John Eichberger |
August 2025
On a regular basis, the Transportation Energy Institute evaluates data related to new vehicle sales and tracks the trends in consumer purchases of different power trains. This information is critical to understanding how the market is evolving and where opportunities for new technologies and energies exist. Yet, we often also remind ourselves and our audiences that while sales are very interesting and give insight into how the market is trending, they do not tell the entire story because they do not address the very large population of vehicles in operation. In this column, we will explore the current market of vehicles and travel behavior that forms the foundation for any possible changes in the transportation market.
Vehicles in Operation
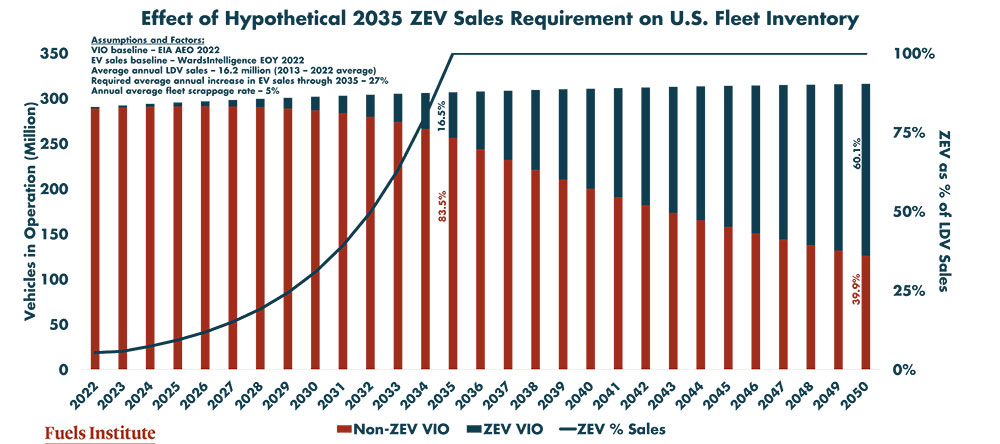
Several years ago, we did a rudimentary analysis of vehicle fleet turnover to help better explain how long it might take to replace the current market with any type of new technology. I called this process cocktail napkin math, because it wasn’t very sophisticated and because many younger stakeholders may be unable to relate to the phrase “back of the envelop,” having never relied on physical mail for communications. In that exercise, we applied historic vehicle sales and scrappage rates to see how quickly a new technology (e.g., zero emissions vehicles) would penetrate the market if every single vehicle sold in the U.S. were so equipped beginning in January 2035. The following chart shows that, should only ZEVs be sold after that date and assuming nothing else changed in terms of sales and scrappage rates, ZEVs would be able to capture approximately 60% of the vehicle fleet by 2050.
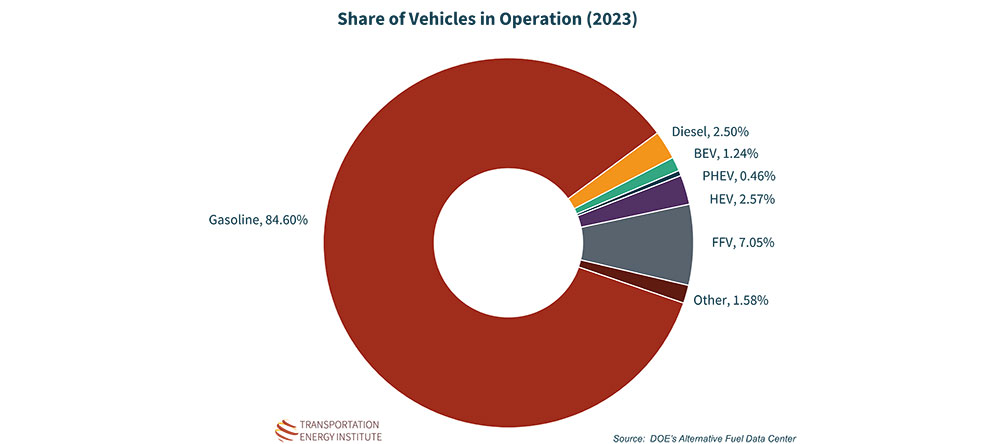
That hypothetical scenario is instructive regarding the size of the market and the time it takes to affect significant change. However, it does not tell us what the market is like today. The Department of Energy’s Alternative Fuel Data Center (AFDC) includes information regarding vehicles in operation in every state, broken out by powertrain type. As of 2023, there were 287 million vehicles accounted for in this data set. Of that, 84.6% were vehicles equipped with gasoline-powered internal combustion engines (ICE). The second largest category was flexible fuel vehicles (FFV), capable of running on gasoline blends with up to 83% ethanol (a.k.a., E85). This FFV market presence demonstrates the importance of evaluating vehicles in operation in addition to sales. Considering that AFDC reports there are only six FFV models for sale in 2025, one may not have assumed there would be 20.2 million FFVs on the road as recently as 2023, accounting for 7.1% of the fleet.
These national numbers are instructive, but for businesses operating in this market it is also important to understand regional diversity. The following maps show the allocation of market share for vehicles with alternative powertrains. This type of insight can help businesses develop their strategies to support drivers more effectively. Some of the results might be surprising.
Flexible Fuel Vehicles
We begin with the second most popular powertrain in the market, FFVs. One might assume these vehicles would be most popular in market where ethanol is produced, considering they can run on E85. But we must remember they are not required to use this fuel and can operate exclusively on gasoline. In addition, not all buyers of FFVs are selecting their vehicles for this technology, they simply happen to select a vehicle so equipped.
The data shows the largest share of FFVs to be concentrated in Texas (11.5%) and California (6.5%). When one considers that the majority of FFVs sold were classified as pick-up trucks, their prevalence in Texas should not be surprising. The higher share of FFVs in California can be linked to the size of the California market, which accounts for 12.8% of all vehicles in the U.S. Supporting the FFV market in California is the fact that 12% of the nation’s 4,743 E85 stations listed in the AFDC. In addition, E85 benefits from the federal Renewable Fuel Standard RIN credit as well as the California Low Carbon Fuel Credit. This provides a significant financial incentive for retailers to offer E85 and for FFV drivers to purchase it. In fact, according to E85prices.com, at the time this column was written E85 in California was priced about 40% lower than E10.

Battery Electric Vehicles
The most talked-about vehicle powertrain in the past several years is the BEV and sales have been trending up, reaching 7.8% in 2024. From 2015 to 2023, according to Wards Intelligence (now Omdia.com) Americans purchased 3.2 million BEVs. By 2023, there were 3.6 million BEVs in operation, or 1.2% of all vehicles in operation. These vehicles were heavily concentrated in California, which accounted for 35.3% of all BEVs in the U.S. California was followed by Florida (7.2%) and Texas (6.5%).
The attention BEVs have received has led many to believe that they represent a much larger share of the market. In fact, in “Consumer Survey – 2025 Driver Behaviors and Perspectives,” TEI found that Americans on average believed that 28% of vehicles sold in 2024 were BEVs, far greater than the 7.8% share they actually represented. Even in California, which is by far the largest state for BEVs, these vehicles represented only 3.4% of vehicles in operation in 2023. BEVs have a bright future, but they remain in the early stages of market penetration.

Hybrid Electric Vehicles
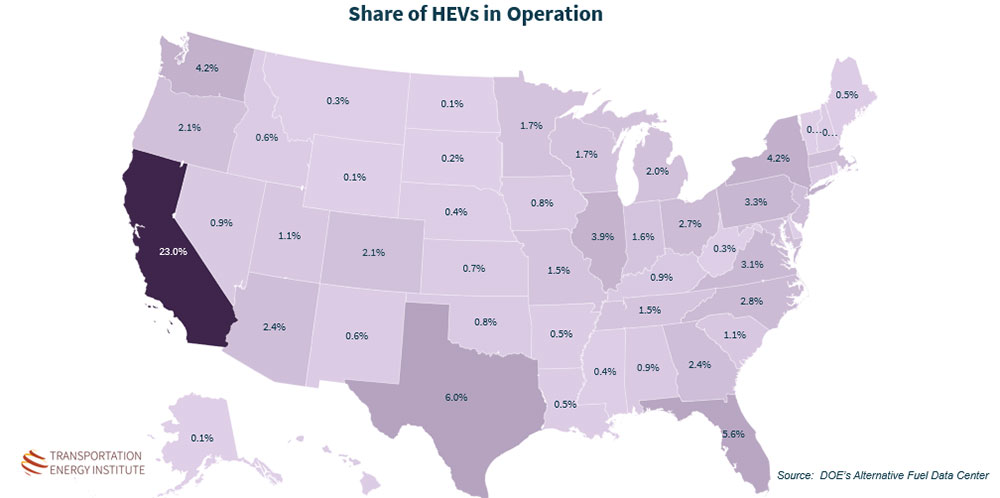
Another powertrain has shown significant growth in sales – the hybrid. Sales of these higher efficiency vehicles, which operate without connecting to the grid, have increased from 3.1% in 2020 to 10.1% in 2023 and 12.3% in 2024. Between 2015 and 2023, Americans purchased more than 5 million HEVs. Despite this performance in sales, HEVs have only increased their share of vehicles in operation from 1.4% in 2016 to 2.6% in 2023. This is another example of the size of the vehicle market and how long it takes for a new technology to gain market share. In addition, even though more than 5 million were sold 2015-2023, the geographic distribution remains heavily concentrated with 23.0% of HEVs operating in California, followed by Texas (6.0%) and Florida (5.6%). Production announcements and the recent increase in sales would suggest that the market share and the geographic distribution of HEVs is likely to grow in the near future.
Conclusion
The vehicle market is dynamic, with consumers presented with more diverse options and models every year. In 2025, buyers certainly have choices of quality vehicles with different powertrains. But the reality is quite obvious – change in this market will take a very long time and can only be fostered by consumer demands. Keeping a sharp eye on sales trends in order to prepare businesses to satisfy the needs of consumers in the coming years is critically important, but keeping our expectations grounded in reality by monitoring the powertrain diversity of vehicles in operation is equally important to avoid investments based upon incomplete and erroneous expectations.

