December 1, 2021
As the world pursues a vision of a decarbonized transportation market, the contribution of battery electric vehicles (BEV) will be significant and instrumental. Yet, one must not confuse the lack of a tailpipe with a vehicle that has no carbon emissions. Likewise, one must not forget that the internal combustion engine vehicle (ICEV) will remain dominant in the market for decades and we must simultaneously pursue options to reduce its carbon emissions. An upcoming report from the Transportation Energy Institute, “Life Cycle Analysis Comparison – Electric and Internal Combustion Engine Vehicles,” to be released in January 2021, takes an objective look at the carbon emissions from each phase in the life cycle of BEVs, ICEVs and hybrid electric vehicles (HEV) to help determine where opportunities exist to most effectively take carbon out of transportation.
EV naysayers like to point out vehicle attributes they believe will undermine the expansion of electrification – in my opinion, this is not constructive. However, there is a path of analysis that can yield positive results. This upcoming Transportation Energy Institute report breaks down emissions at each stage of a vehicle’s life cycle allowing readers to identify opportunities to make each vehicle type cleaner and to deploy the best technologies within certain use cases to achieve the greatest emissions reduction as efficiently and effectively as possible.
This article presents a short summary of this report. Written by Ricardo Consulting, the paper starts with a review of more than 150 documents evaluating life cycle analyses (LCA) to determine commonalities and establish consistent parameters. Ricardo then engaged Argonne National Laboratory’s GREET model to develop a baseline LCA for the average U.S. market before evaluating various scenarios to see how they might affect carbon emissions. The paper was designed to move beyond the finger pointing between EV and ICEV advocates and establish a foundation upon which we might be able to encourage more constructive discussions about carbon mitigation strategies.
The National Average
While not the best way to optimize deployment of solutions, establishing a national average for life cycle carbon emissions is a good way to start. The baseline assumes a vehicle is a small utility vehicle and runs for 200,000 miles over its life time. The ICEV operates on E10 and the BEV has a 300 mile per charge range and is powered by a utility system that reflects the average carbon intensity of the U.S. grid. Under these generic conditions, a BEV delivers nearly 41% fewer tons of carbon over its lifetime than a comparable ICEV. Meanwhile, a typical HEV delivers nearly 29% fewer tons of carbon. (These results are comparable with other LCA’s presented in other reputable studies.)

What is important to note about this data is that the carbon emissions of the vehicles occur at different stages of their lifecycle. Because the BEV emits zero carbon when in operation, all of its carbon emissions occur before vehicle operation. By contrast, the ICEV generates the majority of its emissions during the combustion cycle associated with driving. When we analyze the carbon emissions associated with material sourcing, manufacture and well to tank (that includes electricity generation and petroleum refining and distribution), the BEV generates twice the carbon emissions as an equivalent ICEV.
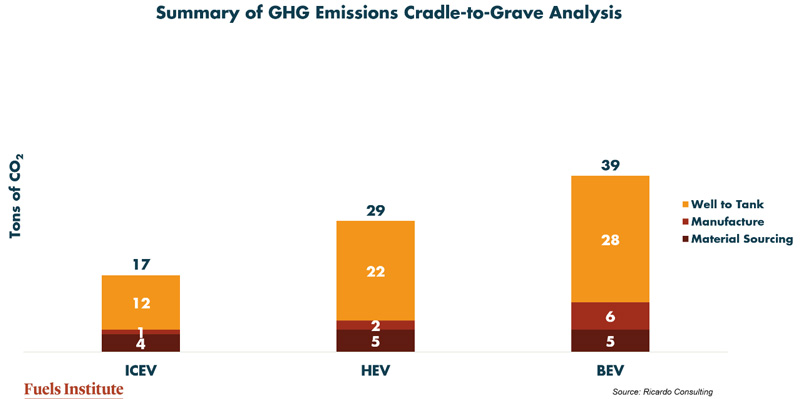
However, once the vehicle starts to serve its purpose (moving passengers and goods from here to there), the relationship changes dramatically. Over a 200,000-mile lifetime, the combustion cycle adds 48 tons of greenhouse gas emissions and increases the ICEV total emissions to a level that is 41% higher than the BEV. Similarly, the HEV’s operations increase its greenhouse gas emissions by 18 tons and results in a total footprint that is 21% higher than the BEV, yet 29% lower than the ICEV.
What this demonstrates is that there are opportunities to reduce carbon emissions for all three vehicle types. If the carbon intensity of manufacture and assembly of the BEV can be reduced, these vehicles will represent a much better option for the market. Likewise, if the carbon intensity of the fuel being used by ICEV can be lowered, the overall carbon profile of ICEVs and HEVs could be reduced and the difference between the three vehicle types could be minimized. This highlights the value of continued research and development in improved vehicle technologies – we must not sit idle and expect emissions to simply disappear. There are opportunities.
Scenario Analysis
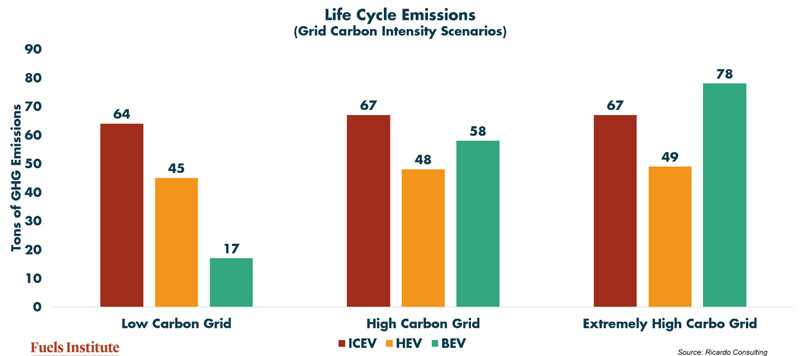
As we consider the potential paths to reducing carbon emissions from each vehicle type, it is important to also understand how variable factors can influence the emissions of each vehicle. The average presented above assumed the BEV was operating in an average carbon intense grid market, but by definition not all markets are average. Ricardo Consulting ran their average results through the GREET model to evaluate how altering certain inputs could affect the life cycle carbon emissions of the vehicles. Among the variables evaluated were total lifetime miles traveled, grid carbon intensity, ambient temperature, driving behavior, vehicle weight, battery chemistry, battery density and different biofuel blends. Let’s take a look at two of these: grid carbon intensity and biofuels.
Grid Carbon Intensity
Where a BEV is operated can have a significant influence on its life cycle carbon emissions. Different regions generate their electricity from different fuels, resulting in wide variation in overall carbon emissions. For example, the United States as a whole generates 40% of its electricity from natural gas, 20% from nuclear and 19% from coal – leaving just 21% to come from hydro and other renewables. By contrast, Maine generates 79% of its electricity from renewables while West Virginia relies on coal of 89% of its power. Consequently, where BEVs are deployed affects their contribution to carbon emissions.
As the following table demonstrates, BEVs emit less carbon than ICEV when operating in all but extremely high carbon grids, yet HEVs represent the cleaner option in all but the low carbon grid markets. Most analysts believe the electricity grid will become less carbon intense over time, but for now it might make sense to optimize vehicle technology to take advantage of market dynamics. BEVs make a lot of sense in low carbon grid scenarios, but a combination of ICEV and HEV with lower carbon intense fuel options might make more sense in some of the other markets. The bottom line of this analysis is this – to find the right solutions to reducing carbon efficiently and effectively requires more complex evaluation of the markets than simply declaring one solution for all situations. When we unpeel the onion, we might find better options.
Biofuels
The other concept that jumps out of this analysis is the importance of reducing the carbon intensity of the liquid fuels that power combustion engines. Even under extremely aggressive BEV sales projections, it will be decades before BEVs replace all ICEV sales. These new ICEVs, combined with the legacy fleet, necessitate progress in ICE efficiency and carbon reductions in the fuel supply. Currently, the great opportunity to affect the fuels market is to leverage biofuels.
From a prior study published by the Transportation Energy Institute, we know that biofuels present a lower carbon profile than petroleum and there have been developments that improve even upon this assessment. The challenge is the fact that most of these fuels are blended in small volume percentages, limiting their overall effect on carbon emissions. When we evaluate the life cycle impact of using different biofuel blends in today’s configurations, the overall impact is not very dramatic. As we can see with the use of biodiesel and renewable diesel in higher blend ratios, the impact on life cycle carbon emissions is much stronger. This raises the question – how can we more effectively leverage the carbon intensity benefits of biofuels to improve the carbon emissions of the combustion cycle in ICEVs and HEVs?

The Full Report
This article presents a very quick sample of some of the findings that came from this new Transportation Energy Institute report. I encourage you to download your free copy when it is available after the first of the year because it contains so much more analysis. In the report, you will learn that the manner in which one drives a BEV will have a significant impact a battery’s range and how often a BEV battery might need to be replaced and that, even when considering the cost of replacing a battery, a BEV still represents a lower total cost of ownership than an ICE vehicle option.
This is a report that can serve as a foundation for further discussion and exploration. There are key takeaways – most important is that we should be taking a critical look at the carbon intense phases in a vehicle’s life and focusing on mitigating these phases to improve the emissions profile of the entire transportation sector. There is no “silver bullet” solution – we must leverage all options available to us and this report will be a tool to help us do that. Watch for announcements from the Transportation Energy Institute when the report is available and visit fuelsinstitute.org to get you free copy.