John Eichberger |
April 2025
One of the pillars of focus for the Transportation Energy Institute (TEI) is to understand how different technologies and energies affect the affordability of transportation. It has been a central tenet of the organization that if a proposed solution is unaffordable or inaccessible to the consumer, it will ultimately fail. As we have seen no evidence to support the contrary, we will continue to proceed with this hypothesis. With this understanding and recognizing the current administration in Washington is primarily focused on supporting traditional energy resources, we thought it might be a good time to evaluate the economics of the petroleum industry. This is further appropriate when we consider that in 2024 liquid fuels still powered 98.4% of light duty vehicles in operation.
Price per Mile
Before we dissect the price of fuel, let’s take a look at how much it costs consumers to drive today. To determine this metric, we are using two metrics from the U.S. Energy Information Administration’s (EIA) Annual Energy Outlook 2025– average miles per gallon (MPG) of new light duty vehicles sole in 2024 and 2025 and the average MPG of the vehicles in operation in each year. We then used the average retail price of gasoline as reported weekly by the Oil Price Information Service (OPIS) Retail Fuel Watch. With this information, we can divide the price per gallon by the MPG the vehicles can achieve to get an average price per mile. Since this calculation returned a value less than 10 cents per mile, we are presenting the information in terms of how much it costs to travel 100 miles.
The figure below shows the economic impact of slow fleet turnover. The dashed lines reflect the cost of travel for vehicles sold in 2024 and 2025. On average, these vehicles can travel 100 miles for $5.62 compared with an average of $10.15 when considering the fuel efficiency of the entire fleet, which includes more than 250 million vehicles sold before 2024. For the first quarter of 2025, due to the influence of gasoline prices (down slightly from $3.29 to $3.13), the fleet could travel 100 miles on about $9.60 compared with $10.43 during the first quarter of 2024.

Share of the Dollar
As we begin to unravel the economics of the petroleum sector, it is important to understand what makes up the gallon that consumers purchase at the pump. For this section, we will focus on the gasoline market. EIA each month publishes a share of the pump dollar metric which shows what percent of the final price charged at retail is attributable to the price of crude oil, the application of taxes, the process of refining crude oil into gasoline and the process of distributing, storing and ultimately selling the gasoline to the end user.
The following chart shows the annual average values from 2021 through February 2025. During this time frame, crude oil was responsible for more than half the price of gasoline. In fact, when we look back as far as 2015, crude oil has averaged 51% of the price of gasoline. For the 10 years prior to that, beginning in 2006, crude oil averaged 64% and exceeded 70% in some months. Consequently, paying attention to the price of crude oil is a great starting point for understanding the price of gasoline.
EIA also reports that taxes have averaged 15% of the price of gasoline since 2021. Taxes are typically assessed at an absolute value per gallon rather than as a percent, so the share of the retail price attributed to taxes can vary quite a bit, for example lower retail prices will yield a high percent attributable to taxes.
Refining operations are often looked at as a key factor in the price of gasoline and since 2021 refining is credited with 15% of the retail price. This share of the retail dollar is consistent with the average going back to 2015 (15.4%), but the volatility is significant recording a monthly low contribution of 2.1% to a monthly high of 27.3%. This is because refinery operations and profitability are driven by the relationship between crude oil prices and wholesale fuel prices, each of which are heavily influenced by traders on the open market.
Finally, distribution and retail accounts for everything that happens after the gasoline leaves the refinery and includes terminal storage throughout the distribution system, pipeline operations, trucking distribution, retail operations and profitability. Since 2021, this component has averaged 15% as well, which is also consistent with the average going back to 2015 (15.5%). Similar to the refining contribution, distribution and retail has varied from a monthly low of 4.5% to a monthly high of 46.4%.

Let’s now take a look at each section individually.
Price of Crude Oil
We will start with the largest component of the retail price – crude oil. The following chart plots the weekly spot price for West Texas Intermediate (WTI) and Brent crude, which serve as benchmarks for the global price of oil. Since January 2023, WTI has averaged $76.44 per barrel and Brent has averaged $80.81. Of course, as can be seen in the chart the price of oil has varied significantly over this time from a high of $95.61 for Brent in 2023 to a low of $66.95 for WTI earlier this year. Clearly, the volatility in this market affects every aspect of the petroleum market.

Refining
Crude oil is largely useless until it is converted into something else, like gasoline or diesel fuel. The process for doing so is complex, energy intense and requires a significant investment of capital to construct and operate the necessary equipment. As of the end of 2024, EIA reports there were 132 operable refineries in the U.S. with a combined capacity to process 18.4 million barrels of oil each day. EIA also reports that these refineries on average convert each barrel into a variety of products, of which an average of 46.0% is gasoline, 29.7% is distillate (diesel and heating oil) and 10.5% is kerosene-type jet fuel. (The yield can vary by refinery and adjustable inputs.)
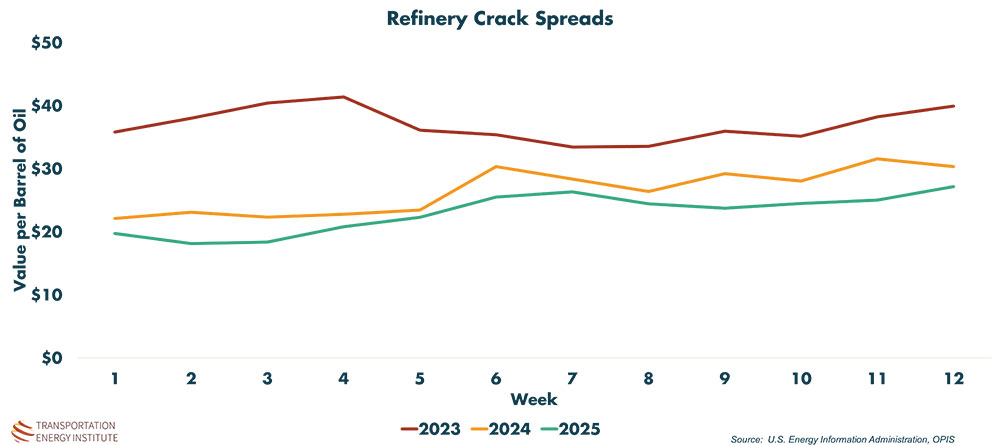
As noted above, refining financial performance is heavily influenced by the market price of crude oil and the market wholesale price of the products produced from that crude oil. Refinery margins are typically referred to as “crack spreads” and reflect the difference between the price of oil and the value of gasoline and distillate produced. This has to cover operations, overhead and any profit generated from the refining process. The following chart applies a basic calculation to derive the average crack spread for refineries the past couple of years.
Crack Spread = [(2 * Price of Gasoline per barrel) + (1 * Price of Distillate per barrel) – (3 * Price of Crude Oil per barrel)] / 3
Using this methodology, we can see that crack spreads during the first quarter of 2025 are the lowest they have been over the past three years, although they are following a similar pattern to prior years. The crack spread is a reflection of the economic health of the refining industry.
It is very important to recognize, however, that this graphic is a broad generalization using the market price of oil and the national average price of gasoline and diesel. Every refinery operates individually, serves different markets and facings unique conditions. Therefore, this chart is just a generic example of what has been happening in the market.
Gasoline and Diesel Prices
The most transparently priced commodity in the market is retail gasoline. With prices posted on signs taller than 20 feet that can be seen for blocks, there is no other product for which consumers can shop for the best price without even slowing down their vehicle. However, it is a largely misunderstood market.
Retailers have to purchase their fuel on the wholesale market, sometimes on the spot and sometimes via a contract which could provide price incentives for satisfying certain conditions. It is important to recognize that wholesale fuel prices can change several times in a single day and most retailers received multiple shipments throughout the week. This creates volatility in the cost of goods sold retailers are seeking to cover with their retail price. These retail prices must cover all operating costs, generate sufficient revenue to purchase the next load of fuel (which could be higher) and a return to the retailer referred to as margin.
In the charts below, we present the national average wholesale price overtime for gasoline and diesel, the retail price of gasoline and the gross margin returned to the retailer (gross margin is used to cover associated expenses like tank insurance, credit card fees, labor, etc.).
For wholesale prices, the annual average price over three years has come down from $2.55 per gallon of gasoline and $2.96 for diesel in 2023 to $2.178 and $2.459 in 2025, respectively. Likewise, retail prices have come down from $3.533 for gasoline and $4.259 for diesel to $3.130 and $3.625.
Meanwhile, retail margins have held relatively steady as a percent of the price of fuel. In 2023, gasoline returned a gross margin of 11.2% and diesel 14.8%. In the first quarter of 2025, gasoline returned 11.2% and diesel 13.3%.


Closing Comments
With liquid fuels continuing to dominate the current fleet of vehicles, it is important to understand how this market works and what makes prices increase and decrease. It is a very volatile market, influenced heavily by commodity traders bidding prices up and down based upon changing market conditions. And we know that the retail price of fuel not only affects consumer’s budgets, it also affects their feelings about the economy in general so understanding these fundamentals is important.
In addition, it is clear that the improved efficiency of newer vehicles benefits the consumer on an energy expenditure basis. What was not included in this article was how much that efficiency affects the cost in the purchase of the vehicle and how these two metrics balance out – that is a topic for another article.