John Eichberger |
October 2024
As the fourth quarter rapidly closes on the end of the year, this might be a good time to take a look at the transportation market and see where things stand in the light duty vehicle market and the fuels sector. The media is constantly changing their tone based upon inflections in the market, trying to get attention by sensationalizing variability in the market. I believe it is much more instructive to look at longer term trends. For this article, we will take a look at approximately five quarters of data – it is not such a long period that it hides short-term volatility, but it is long enough to provide some context for what we might be seeing today.
Vehicle Sales
First, one of the major questions is how fast will the market evolve to incorporate a larger volume of electrified vehicles. Total light duty vehicle sales have bounced around between 3.8 and 4.1 million vehicles per quarter, for an annual range of 15.2 – 16.4 million units for the year. (There are sophisticated models projecting seasonally adjusted annual rates of vehicle sales, but I really like simple math – quarterly sales times four. This does not take into account seasonal variations, but it is simple.) The following charts show what powertrains are being sold. The first shows total units sold while the second shows share of total sales for each powertrain.
From this data, we see that Americans have purchased 19.6 million new vehicles in the past five quarters, of which nearly 16 million (81.3%) were combustion vehicles, 1.5 million (7.6%) were battery electric, 400,000 (2.0%) were plug-in hybrids and nearly 1.8 million (9.0%) were hybrid. We can also see how market share changes quarter-to-quarter and can drive media headlines.
At the end of 2023, the media was claiming that the shine had faded from electric vehicles because sales had declined, but since Q1 2024 sales have recovered and recorded a significant increase in Q3. The variability seems more extreme because the U.S. only sells around 300,000 BEVs per quarter so a shift of 30,000 units is a big percentage. By comparison, the U.S. sells close to 4 million combustion vehicles – to record the same percentage variability, sales would have to change by 400,000 units. Of course, the media will make a lot about this relative growth in EV sales without considering that there may be a slow-down in the future like there was in the past. The key takeaways are the market is evolving, vehicles that require liquid fuel continue to dominate sales, and electric vehicle sales continue to grow but are likely to remain volatile based upon any number of external factors.


Another key trend to which we should pay attention with regard to vehicle sales is the type of vehicle consumers are buying, rather than just the powertrain. For many years, the dominant vehicle type has been the crossover utility vehicle and that has not changed. These vehicles represent half of all light duty vehicles sold in the United States. Meanwhile, pickup trucks continue their popularity hovering around 18% of all units sold. These facts may be surprising given pickup trucks have been the most popular models for many years, but it is worth noting that there were only 25 pickup models sold through Q3 2024 while there were more than 220 crossover models sold during that time.
Of particular note, among the crossover models sold through Q3 2024, the most popular was the Tesla Model Y. With more than 297,000 units sold, the success of this vehicle indicates that electric vehicles have great potential when they meet consumer needs and interests. At the same time, detractors might dismiss this number and point out that the most popular vehicle overall, the Ford F150, sold 429,000 units through Q3. But such a comment ignores the fact that the number of competing options for pickup trucks is much more limited than options for crossovers. We have to take all of those factors into consideration when trying to make sense of this data.


Fuels Markets
With more than 90% of vehicles sold in the past five quarters equipped with an internal combustion engine, and considering approximately 98% of vehicles in operation in the United States are so equipped, it is important to understand what is happening in the fuels market. Typically, the media only pays attention when there is an unexpected or unacceptable increase in prices for either crude oil or gasoline. And this makes sense – consumers are extremely sensitive to price volatility at the pump and it has a significant impact on how they feel about the economy in general.
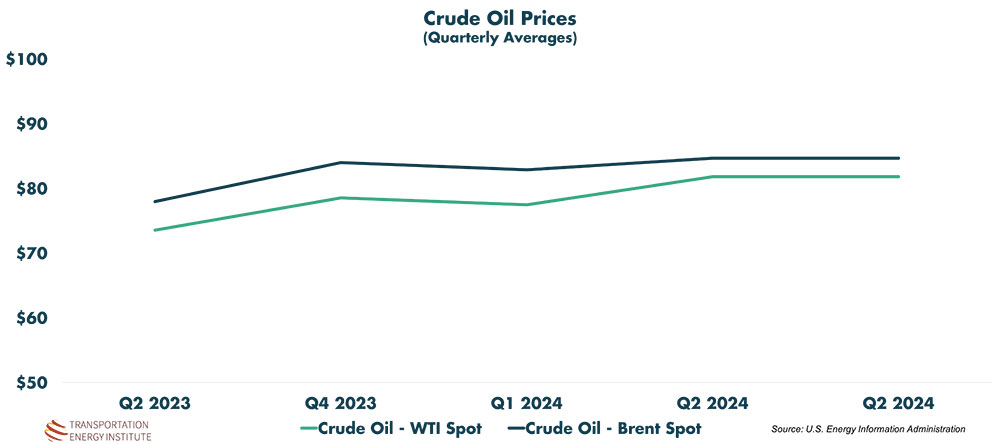
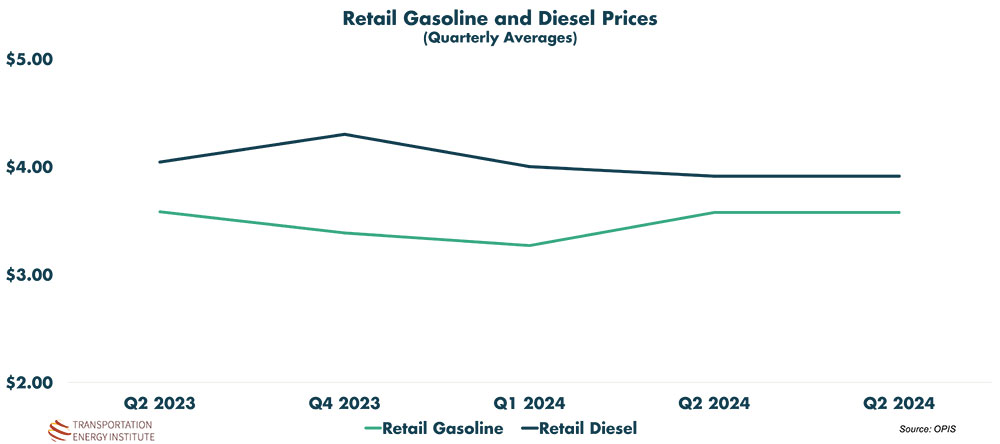
Looking at the past five quarters, we see that the two benchmarks for crude oil – West Texas Intermediate and Brent – have both trended up, 11.2% and 8.6% respectively. Meanwhile, contrary to tradition in which retail prices follow crude oil prices, retail prices for gasoline and diesel dropped slightly, -0.2% and -3.2% respectively. This five quarter trend, however, does not really describe the volatility that the fuel markets experience over time.
If we look at the weekly reported prices for these commodities, the influence of external factors (e.g., seasonal regulations, global geopolitical events, trader sentiments) become more evident. While crude oil has gone up on a quarterly average basis, the volatility within each quarter can have a significant influence on the retail price consumers pay at the pump. It is important to remember that crude oil typically represents more than 50% of the retail price of gasoline.


Conclusion
There remains a quarter to go this year, and the vehicle industry will try to end the year on a positive note, driving sales as high as they can get them. What powertrain those vehicles might be equipped with remains to be seen, but it is a safe bet that the vast majority (more than 90%) will have a combustion engine and need liquid fuel. As we have reported many times, Oak Ridge National Laboratory evaluated fleet turnover and found that half of the light duty vehicles sold today will remain on the road for at least 16 years, so understanding the fuels market remains critical to understanding the transportation sector.
After studying data and consumer behavior for more than 20 years, I can report that affordability at the pump has a major influence on consumer interest in fuel efficiency, alternative fuels and alternative powertrains. If events were to transpire to raise crude oil, and by extension retail fuel, prices, we could see an increase in consumer interest in hybrids and battery electric vehicles as a result.
A significant wildcard to watch, as we assess the final quarter of 2024, will be used vehicle sales as more BEVs enter the market and present a more affordable, non-fuel dependent options for those struggling to purchase a vehicle. Whether or not this might impact new car ICE sales is yet to be determined, but it is something to watch.
This is a dynamic market that is continuously changing and TEI will continue evaluating the data and provide as much perspective as the data allows.