 By John Eichberger | May 2026
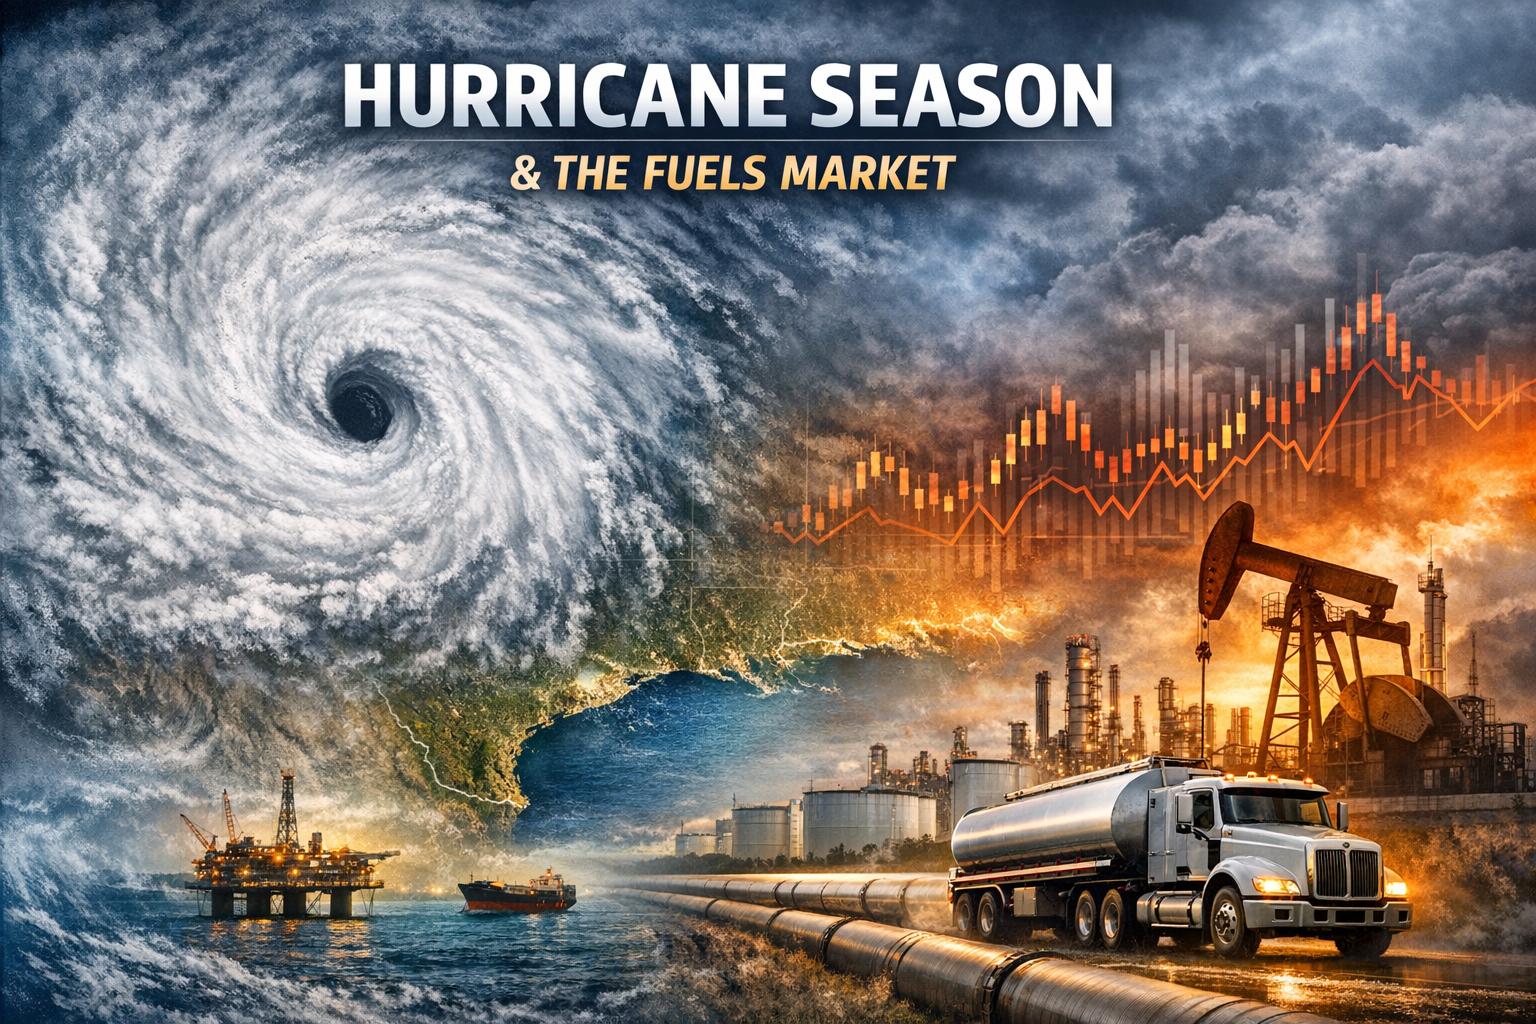
On May 21, 2026, the National Oceanic and Atmospheric Administration (NOAA) released its forecast for this year’s hurricane season, predicting a 55% chance of below-normal storm activity. The forecast predicts 8 – 14 named storms, including 1 – 3 major hurricanes. For comparison, last year there were 13 named storms and looking back at 2020 there were 30. NOAA reports 70% confidence in this forecast but acknowledges a 10% chance that storm activity could be higher than normal. Despite a more conservative outlook, given the state of the fuel market at the end of May, any type of disruption to the Gulf Coast could have a significant impact on the economy and the industry needs to do everything it can to prepare.
We pay attention to hurricane season because there is a strong chance that any major storm that hits the mainland will pass through the Gulf Coast, which represents the heart of the U.S. petroleum system. According to the U.S. Energy Information Administration, refining infrastructure in this region, stretching from Texas to Louisiana, accounts for 49% of the U.S. operable refining capacity. The region also accounts for 57% of U.S. crude oil production and receives 19% of U.S. oil imports. When this area is disrupted, the implications are experienced by consumers throughout the country. Many remember the challenges the market faced in 2005 when the area received the one-two punch of Hurricanes Katrina and Rita – fortunately we learned a lot of lessons following that experience.
Fuel Infrastructure and Distribution
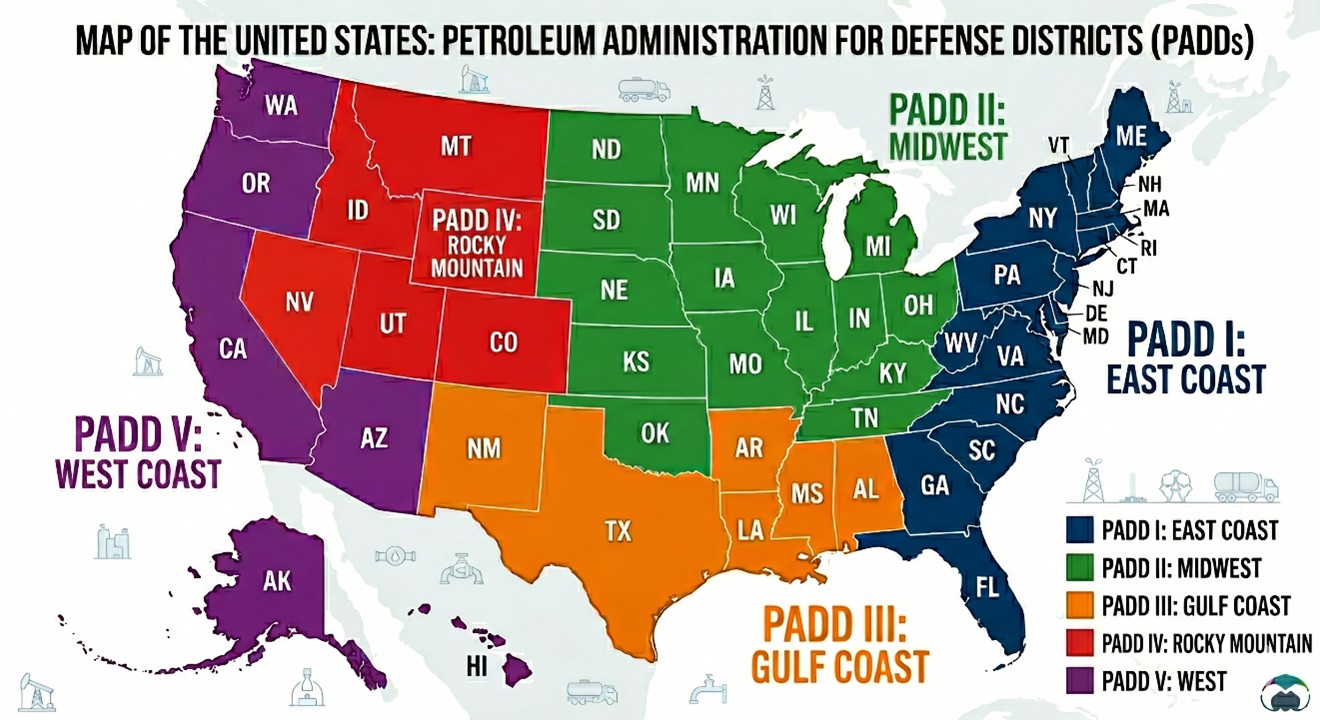
One of the objectives of TEI is to help non-industry stakeholders understand how the market works. Often, when something affects the Gulf Coast, many will wonder why markets in New England and the Pacific Northwest might react. The reality is the market is fully interconnected.
EIA data shows that in 2025, the Gulf Coast region known as PADD 3 delivered refined products like gasoline and diesel to the rest of the country. The table below demonstrates that the East Coast is the most dependent on PADD 3, receiving 65.7% of the gasoline and 73.3% of the diesel fuel it consumed in 2025. Other regions are less dependent, but even the Pacific Coast relies upon the Gulf Coast for about 10% of its supply. Importantly, it only takes a small change in supply to affect markets and prices at the pump. Consequently, this supply is critical to the economy.
Movement of Refined Products in 2025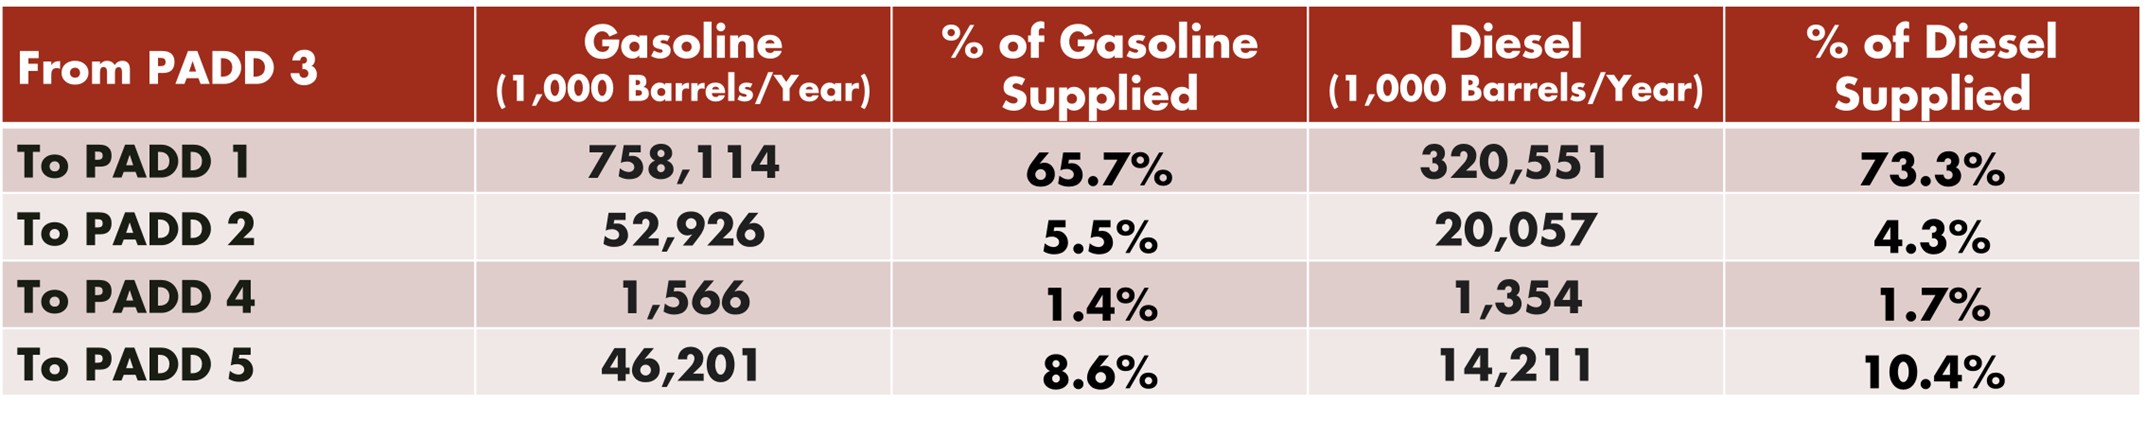 Source: U.S. Energy Information Administration
To help people understand how the liquid fuel system operates and why it can be vulnerable to extreme weather events like hurricanes, in 2016 TEI published Assessment of the U.S. Fuel Distribution Network. This resource explains how a complex system of refineries, pipelines, storage terminals, barges, and trucks moves 605 million gallons of fuel (gasoline, diesel and jet) across the country every day – and it is truly remarkable how efficiently and reliably the system performs.
Each day, the U.S. processes more than 18 million barrels of oil, producing nearly 20 different refined products. In 2025, this included 136.5 billion gallons of gasoline, 59.6 billion gallons of diesel and 26.5 billion gallons of jet fuel. Once refined, these fuels are moved from refineries (131 operable) to terminals (more than 1,400), transported to other terminals by pipeline (more than 230,000 miles), loaded into tanker trucks in local markets and delivered to retail facilities (more than 150,000) for final sale to consumers – and the incidence rate of consumers arriving at a retail station that does not have fuel is extremely rare, even during tight supply conditions. EIA has provided a nice graphic showing the different stages of distribution.
To put this into further context, the largest pipeline in the U.S. is Colonial Pipeline, which delivers product from the Gulf Coast up the eastern seaboard to New York. That line runs 5,500 miles, receives product from 28 refineries, connects to more than 270 storage terminals, moves more than 100 million gallons of product every day and serves more than 50 million consumers.
Market Outlook
As we enter hurricane season in 2026, the market is already in a vulnerable state due to the conflict in Iran and the effective closure of the Strait of Hormuz. TEI hosted a webinar May 21, 2026, with two renowned experts who reported that domestic gasoline supplies were already at their lowest levels since May 2014 and that once the Strait begins to resume normal operations it will take 12 – 18 months for supply flows to recover to their pre-conflict state of operations. S&P Global Energy is predicting in its base-case forecast that oil prices could reach $130 per barrel in June or July.
All of this means that the market already is in for a rough ride and if we layer a hurricane disruption over the top of it the results could be significant. Understanding how the market functions can help alleviate some of the speculation and hearsay that often accommodates market disruptions.
That said, the system is resilient and the industry is constantly evaluating its preparations to respond effectively to any potential disruption. Especially since the 2005 hurricane season, the coordination between the government and key industry stakeholders in advance of incoming storms has greatly enhanced the preparations and response to Gulf Coast storms and provided significant benefits to consumers. Recent experiences have been modest compared to 20 years ago and there is no reason to believe the industry would not respond efficiently again in the event of a storm affects the market. Let’s all hope, however, that the Atlantic storm activity takes a pass on the Gulf Coast this year and provides the market time to stabilize following the conflict in the Middle East.