John Eichberger |
June 2024
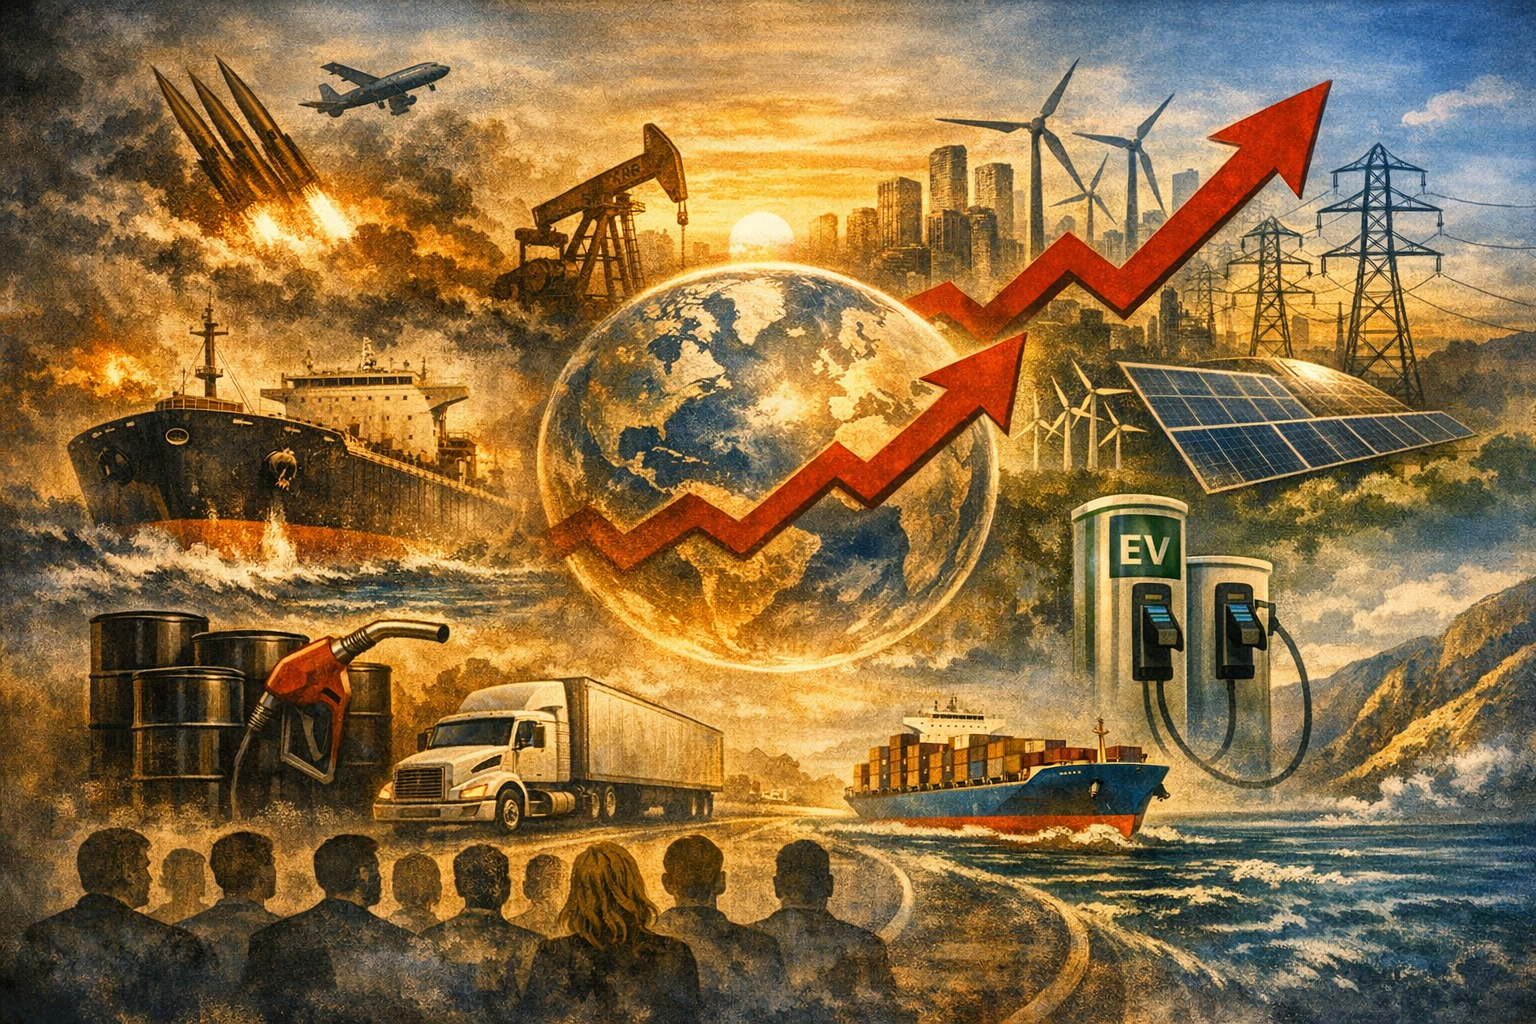
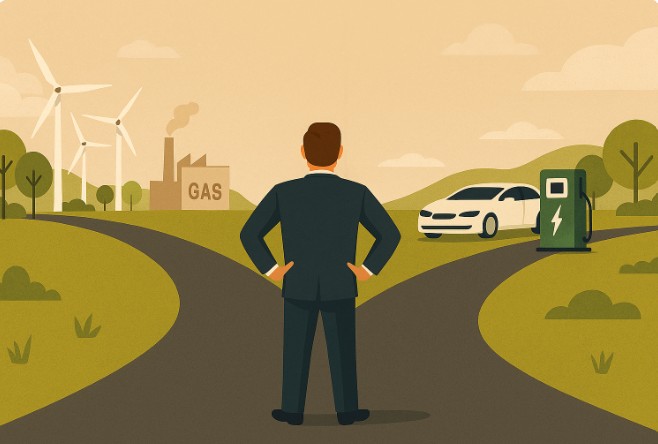
Taking complex topics and boiling them down to simple analytics can be very useful to provide people with a basic context. In this article, I will present some basic calculations and analyses related to reducing greenhouse gas (GHG) emissions from transportation and demonstrate the value of pursuing a lower carbon liquid fuel while bringing new technology vehicles to market. We can have a much more significant positive impact on the environment if we seek multiple solutions for the transportation sector.
I started doing some of this type of analysis a few years ago, using simple data and calculations to show the time it might take for the vehicle fleet to turnover to EV’s. Such analysis is not intended to be exact or designed to pass through rigorous examination. For this reason, I like to call it cocktail napkin math (many younger people would not know what I meant if I used the old phrase “back of the envelop calculations”). I recently did this with regards to potential greenhouse gas (GHG) emissions from the light duty vehicle fleet. Here is what I came up with.
Fleet Turnover
First of all, it is critical to understand that the vehicle fleet is very large and that vehicles remain on the road for a very long time. Often, people like to quote statistics about the average age of a vehicle (currently, more than 12 years), yet I have always found that to be confusing. I prefer to look at data published by Oak Ridge National Laboratory. In their analysis, they found that 50% of the light duty vehicles (LDV) sold today will remain on the road in 16 years and some of them will continue in operation for up to 30 years. For reference, it is worth noting that in 2023 U.S. consumers purchased 14.5 million vehicles equipped with combustion engines. For heavy duty vehicles, 50% sold today will remain in operation in 27 years. Understanding the long-tail on this dog is so important to evaluating how successful our efforts to reduce emissions might be. (The following chart was taken from the TEI report, “Decarbonizing Combustion Vehicles – A Portfolio Approach to GHG Reductions”)

Background
The Transportation Energy Institute has published several papers in recent years evaluating the potential to reduce carbon emissions from the transportation sector – these are great papers and I encourage you to read them, but it may not be immediately clear how they all fit together. Here are some of the key findings from two such reports relevant to my recent calculations:
Life Cycle Assessment – Published in January 2022, this study sought to better understand the GHG emissions over the entire life cycle of an internal combustion engine vehicle (ICEV), hybrid electric vehicle (HEV) and battery electric vehicle (BEV). It reviewed the harvesting of materials, manufacture of the vehicles and the energy they use, operation of the vehicle and consumption of energy and ultimate disposal of the vehicle. The following chart is a high-level summary of the findings from that study. As can be seen, over an expected 200,000-mile life, a BEV charged with electricity equal to the average carbon intensity (CI) of the U.S. electricity grid emits 41.5% less GHG than an ICEV and an HEV emits 27.7% less. Overall, total tons of GHG emitted by each vehicle was calculated to be 65 tons for ICEV, 47 tons for HEV and 38 tons for BEV.

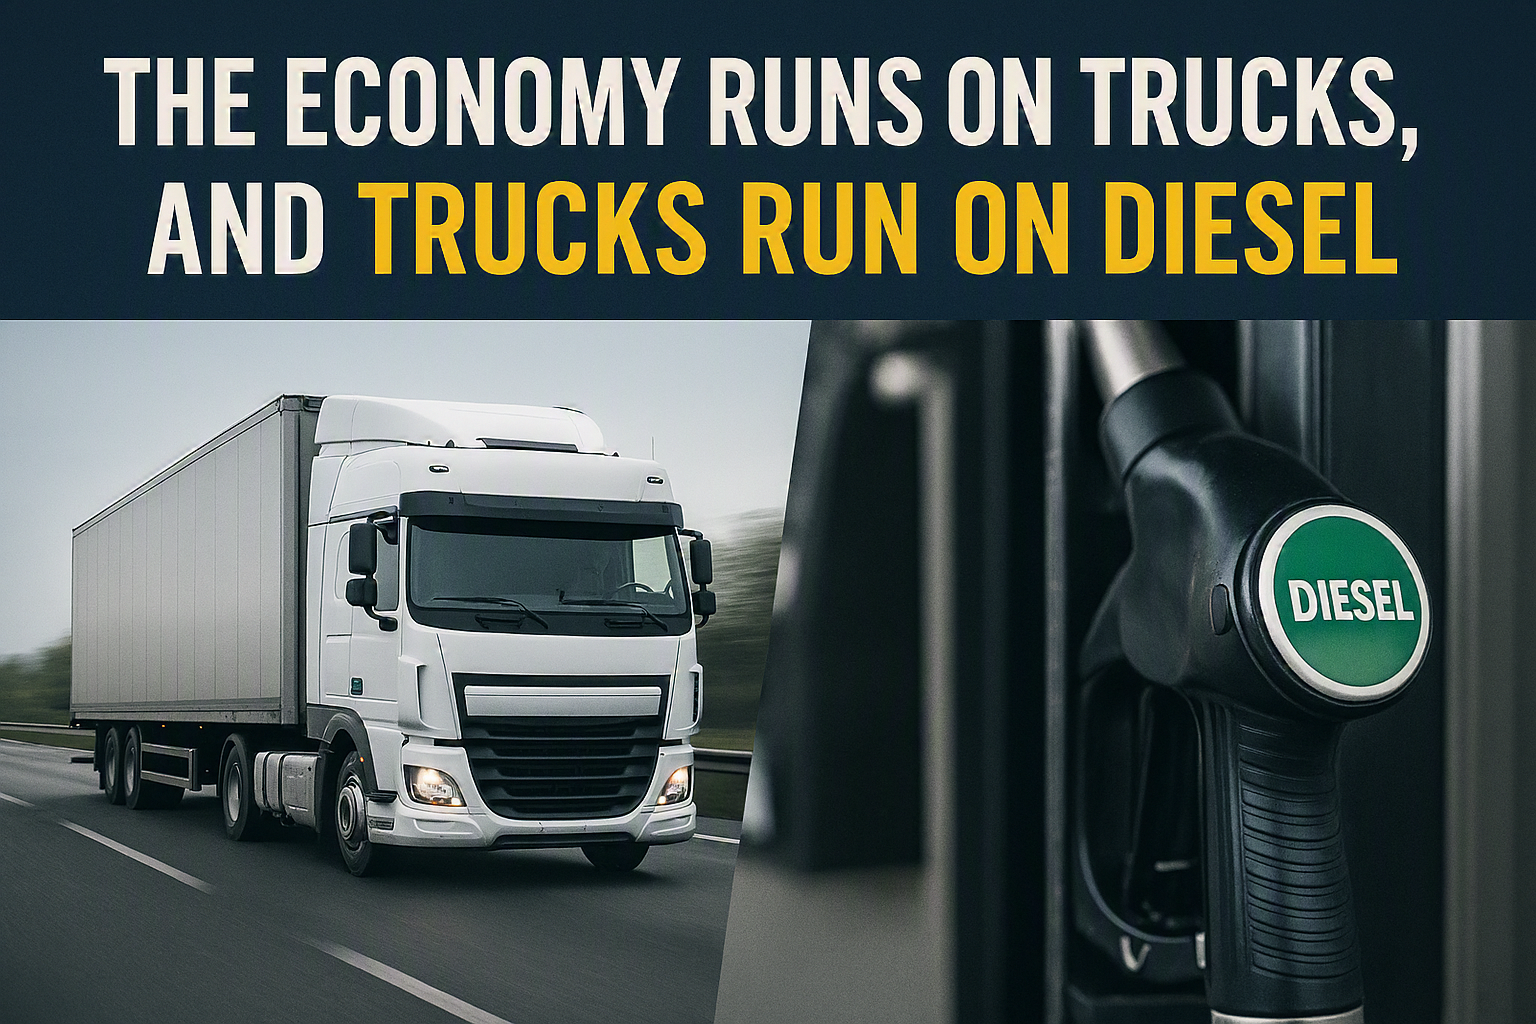
Decarbonizing Combustion Vehicles – Published in July 2023, this study sought to better understand the options for reducing carbon emissions from traditional ICEV, especially the nearly 300 million currently in operation in the United States. According to our report on how to decarbonize ICEV, we found there is potential to significantly reduce the carbon intensity of liquid fuels being used in the ICEV population. From changes in the oil and agricultural production fields, in oil and bio-refineries, in fuel composition and blend levels, there is potential for significant reductions the carbon intensity (CI) of liquid fuels. If the market were to take full advantage of options to reduce the CI of petroleum and ethanol while increasing blend levels to E15, we could potentially reduce gasoline CI by 35%. Our lifecycle report found that 73% of all ICEV-related GHG emissions come from the fuel. Over the lifetime, that means 47 tons of ICEV GHG emissions come from the fuel. If that fuel were 35% lower CI than traditional fuel, carbon emissions could be reduced by 16 tons, for total ICEV lifecycle emissions of 49 tons, which would be 25% lower than modeled in our report and almost equal to HEV emissions.

Fleet Composition and Associated Emissions
How does this translate to overall transportation emissions? According to the U.S. Environmental Protection Agency (EPA), LDVs (cars and LD trucks) emitted 1.030 billion metric tons of GHG in 2022. According to the U.S. Energy Information Administration (EIA), in 2022 there were 125 million cars and 137 million light trucks in operation in the US. This translates to an average of approximately 2.9 metric tons per car and 4.8 metric tons per truck in operation. By 2040, EIA projects the vehicle population to include 87 million cars and 191 million trucks.

Scenarios
There are wide variety of forecasts relative to the adoption curve of BEVs, some laughably pessimistic and some wildly optimistic. Let’s assume an aggressive adoption curve in which 100% of vehicles sold by 2035 were zero emissions vehicles (ZEV). [Note – No vehicle is zero emission on a lifecycle basis, so interpret “ZEV” to mean zero “tailpipe” emission.] The fleet turnover calculation I performed for this scenario projects that by 2040 35.6% of vehicles in operation would be ZEV.

The above scenario assumes a federal mandate for ZEVs to comprise 100% of LDV sales in 2035, which is a policy that does not exist and would be very challenging to achieve. However, it is not unreasonable to assume that by 2040 BEVs could account for 20% of vehicles in operation (VIO). It also is not unreasonable to assume by 2040 traditional HEVs could account for 20% of VIO.
Using these assumptions, I created five scenarios and used the data presented above to calculate what the LDV GHG emissions could be in each. I have also considered whether the fuel pool maintained the CI it had in 2022 or if industry investments were to successfully reduce the CI of the pool by 35%, as mentioned above. To estimate the GHG emissions per vehicle, I took the emission profile from 2022 and applied the percent reduction for each option – 41.5% lower for BEV, 27.7% lower for HEV and 25% lower for a low carbon fuel.

The scenarios include the following:
- Scenario 1 – All VIO are ICEV and operate on fuel with a CI equal to 2022
- Scenario 2 – All VIO are ICEV and fuel has a CI 35% below the 2022 fuel pool
- Scenario 3 – 20% of VIO are BEV, remaining ICEV run on 2022 fuel
- Scenario 4 – 20% of VIO are BEV, remaining ICEV run on low CI fuel
- Scenario 5 – 20% of VIO are BEV, 20% are HEV* and remaining ICEV run on low CI fuel
(*HEV GHG emissions do not account for a low CI fuel)
The results of these scenarios are presented in the next chart. As expected, maintaining the status quo through 2040 would result in the highest amount of carbon emissions. However, the three scenarios in which the fuel pool had a lower CI resulted in the greatest GHG emissions reductions. Scenarios 4 and 5, which include market penetration estimates of BEVs and HEVs, did deliver the greatest emissions reductions overall, but it is worth noting that Scenario 3 shows that absent a low carbon fuel solution the penetration of alternative vehicles does not deliver nearly as much benefit to the environment.

Conclusion
Remember, this is not a scientific examination and does not include the majority of variables that would affect the outcome of a more robust model. I also recognize that my estimation of GHG emissions per vehicle is rudimentary, does not include improvements in vehicle efficiency, reduced CI of electricity generation, and a host of other factors. However, this simplistic approach demonstrates that reducing the CI of the fuel pool is a critical element to reducing GHG emissions from the LDV market. This is because the current fleet is so large that it will take decades to replace it with something new. Consequently, even as the market embraces more alternative vehicles, it is imperative that policies and industry strategies simultaneously support and pursue lower carbon liquid fuels. This combination will be the most effective means of reducing emissions and should be part of the blueprint for a more sustainable transportation sector.