John Eichberger |
August 2026
I grew up a stone’s throw from Disneyland and many of my fondest memories from my childhood include echoes from that park:
- “Remain seated please – Permanecer sentado, por favor.” – The Matterhorn Bobsleds
- “Hang on to those hats and glasses ‘cause this here’s the wildest ride in the wilderness!” – Big Thunder Mountain Railroad
I have found those tracks (pun intended) running through my mind quite a bit this year as we deal with the turmoil that has shaken the global energy markets. The Transportation Energy Institute (TEI) has tried to keep a finger on the pulse of what’s going on by engaging with our members and expert analysts throughout the year. In this column, I want to share some additional information about what we are experiencing as of August 2026 – of course, within a week or two there may be very different dynamics at play. Hang on!
Crude Oil
Crude oil has been the primary story all year since 20% of global supplies pass through the Strait of Hormuz, which has been essentially closed for most of the year. But the challenge is not just because the waterway is closed, there are several additional consequences that deserve attention:
- Hormuz: It is no secret that shutting down the Strait deprived the world of oil, but the future market traders have exacerbated the turmoil by responding to news cycles about it opening and then closing again. What many fail to realize is that even if safe passage is diplomatically restored, many insurance providers may be slow to support passage until there is certainty of safety. In addition, analysts project it will take weeks or months for tankers to be rerouted back to the region and until mid-2027 for regional export flows to return above 80% of pre-crisis baselines.
- Relief Valves: In early 2026, the loss of Gulf oil was partially cushioned by large drawdowns from China’s safety reserves and the U.S. Strategic Petroleum Reserve. In addition, the U.S. maximized its own oil export capabilities. By mid-2026, however, these buffers flattened, U.S. export capacities peaked and the SPR dropped to its lowest levels since 1982.
- Alternative Pathways: Gulf producers have accelerated overland pipeline routes to move crude outside the Gulf, but structural limits prevent these bypasses from fully offsetting the deficit. In addition, efforts to redirect supplies to the Red Sea and through the Bab-el-Mandeb Strait have come under attack by Houthi rebels in Yemen. Other efforts to maximize capacity through other pathways have replaced a small portion of supplies while other projects to build pipelines will take months or years to complete.
Refining Capacity
The situation is not solely one about crude oil, however, and this brings into the discussion another geopolitical conflict – Russia and Ukraine. The combination of these two conflicts has removed approximately 9% of global refining capacity from the market.
- Russia: Ukraine’s increased use of drone and missile strikes have hit over 20 primary crude distillation units (CDUs), catalytic crackers, and hydrocrackers across European Russia, taking 20% – 40% (1.2 to 1.5 million barrels per day) of Russia’s domestic refining capacity offline. Meanwhile, Western sanctions have turned routine multi-week turnarounds into multi-month structural outages.
- Persian Gulf: Direct missile and drone exchanges and commercial blockades around the Persian Gulf removed more than 20% of Middle East capacity from the market (about 3.5 million barrels per day). In addition, loss of feedstock deliveries from the Strait of Hormuz forced export-focused Gulf refiners and import-dependent Asian refiners (across South Korea, Japan, and India) to cut run rates below normal utilization.
- U.S. and Europe: To compensate for Eastern outages, U.S. and European refiners maximized utilization. U.S. operable capacity utilization reached 96.2% (about 17.1 million barrels per day crude input), leaving virtually zero spare conversion capacity to absorb unexpected operational upsets. In addition, refiners maximized production in the first half of 2026 and deferred non-critical turnaround maintenance. However, because units cannot run indefinitely without such maintenance, deferred major overhauls across the U.S. Gulf Coast, Mediterranean, and Northwest Europe are concentrating into an aggressive fall maintenance cycle, tightening global product balances just ahead of winter heating demand.
Canada
To add a cherry to this sundae, there is the escalating trade war between the U.S. and Canada. Canada supplies the U.S. with 60% of its imported crude oil, more than 4 million barrels per day. And this oil is the heavy sour crude that U.S. refineries are designed to process. With supplies from the Persian Gulf interrupted, it would be difficult to replace this supply should it be affected. In addition, Canadian refined gasoline and diesel fuel are important products supplying the states of New England. On the flip side, the U.S. exports approximately 700,000 barrels per day of oil and refined products to Canada. Disruption to energy flows could have a significant effect on both economies.
Expectations for U.S. Market
Looking toward the end of 2026, the primary supply concerns for the United States across crude and refined petroleum products center on depleted inventory, an inflexible and maxed out refining slate, and sharp seasonal demand shifts. In recent conversations with industry experts, diesel has become one of the major points of concern.
As of August 21, U.S. total supply of distillates was 9.5% below 2025 and 16.0% below 2024. For ULSD, inventories were down 11.0% and 17.9%. The loss of global refining capacity has severely cut inventories of middle distillates, and the required turnarounds for domestic refineries will limit output as demand for harvests and home heating oil increase. An increase in production of biodiesel in response to the obligations of the Renewable Fuel Standard provides additional supply, but it won’t be enough to offset the losses.
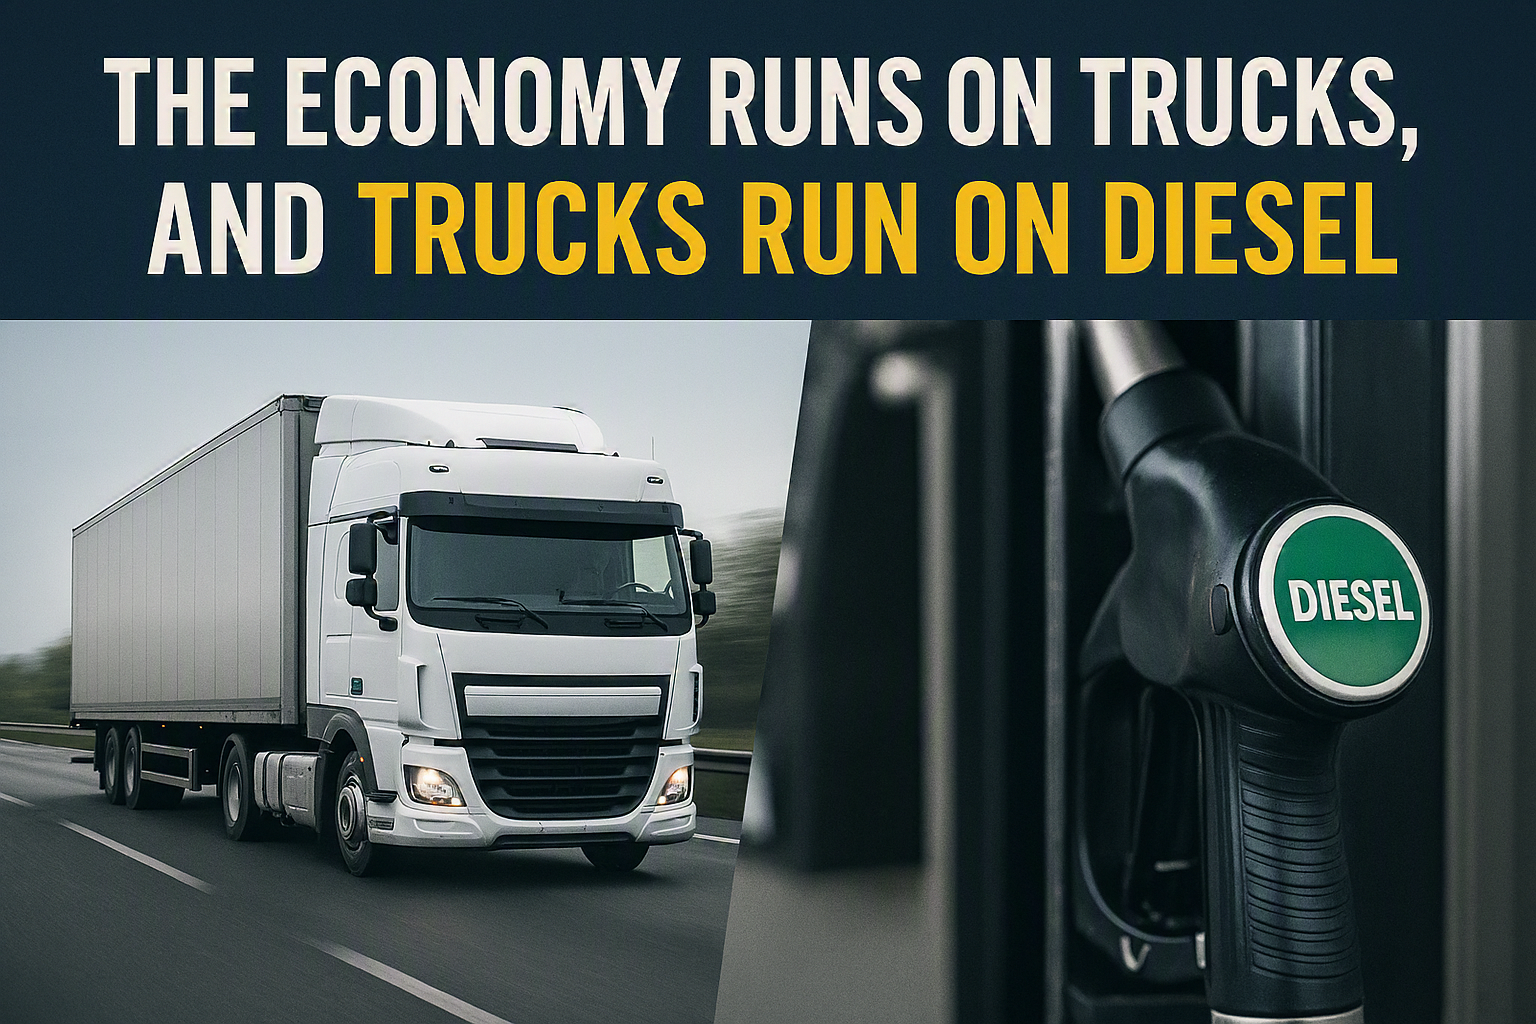
Diesel was averaging $5.652 per gallon nationally, with the West coast averaging $6.407 and California averaging $7.040. The tight supply situation and high prices have a direct and significant impact on the economy, as every product delivered and sold will be affected by the increased cost of distribution.
Another consequence of refiners potentially maximizing their distillate production is a reduction in gasoline production. The U.S. is already at low inventories and while demand typically tapers off after Labor Day, it may not be enough to offset supply constraints.
Another wild card in both of these situations is the weather. Hurricane season is not over, and we know by experience what effect a major storm can have on supplies. And if the winter is as cold as it was last year then demand for heating oil will put additional pressure on supplies.
We definitely need to “remain seated” and “hold on to our hats and glasses,” because this wild ride is not over yet.
Upcoming
The Transportation Energy Institute is about to publish a new paper by S&P Global Energy summarizing the flow of petroleum supplies throughout the world in 2025 before the Iran conflict broke out, to serve as a baseline for evaluating the market today and tomorrow. We will be following that up with a roundtable discussion for TEI members about how the system might evolve in the aftermath of this year’s events. And we have a session planned for the NACS Show and the new TEI-NACS Future of Mobility Summit. Stay tuned – a lot more analysis and insights from market experts are coming.